Long live the scatter plot
Jun 21, 2022
When should you use a scatter plot?
Scatter plots are useful for exploring relationships.
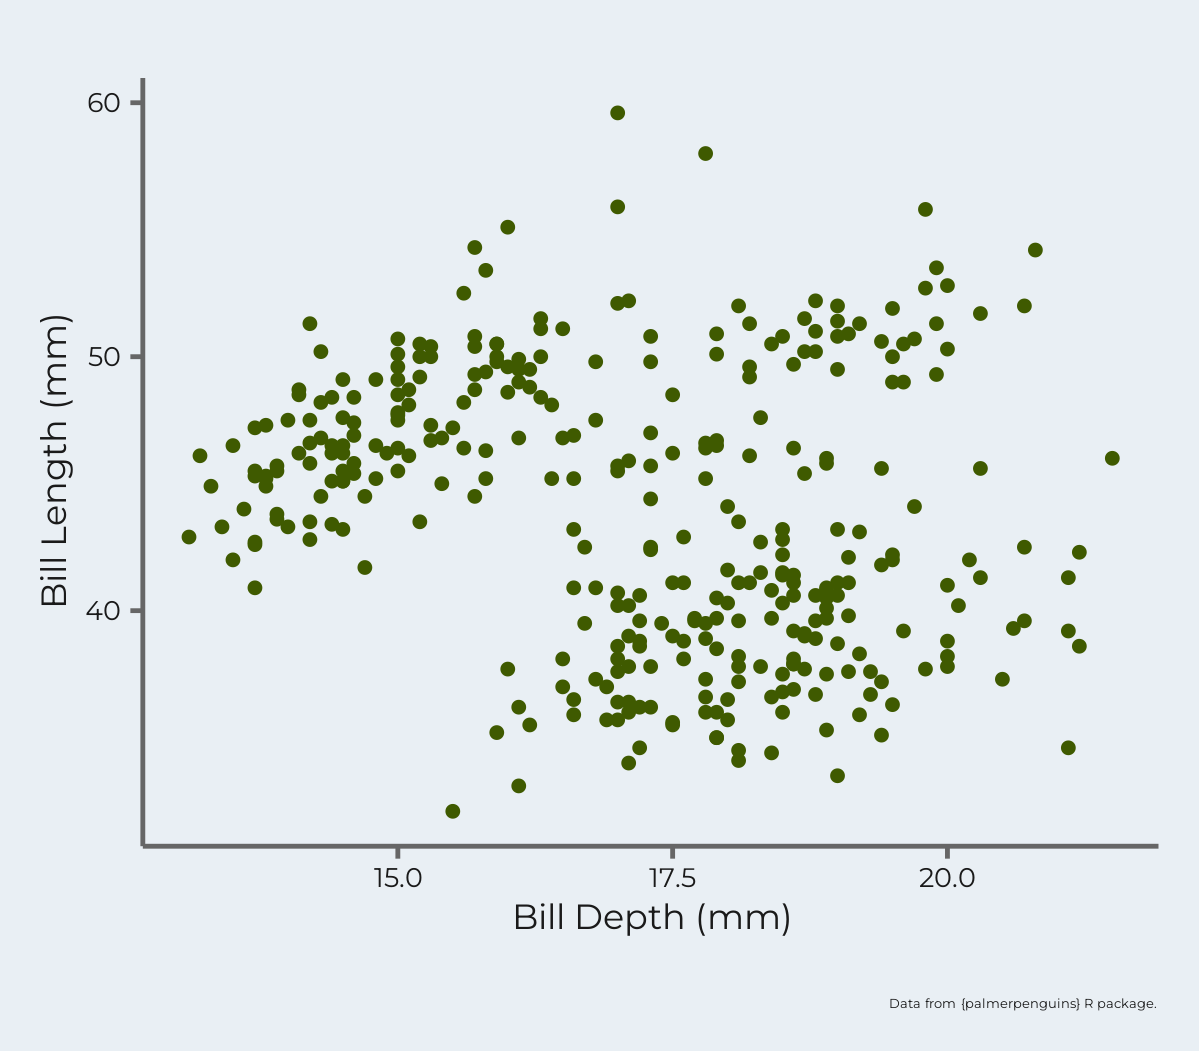
You need two sets of numbers to make a scatter plot. One set goes on the x-axis and the other goes on the y-axis.
Here, we're looking at the relationship between bill depth and length for penguins.
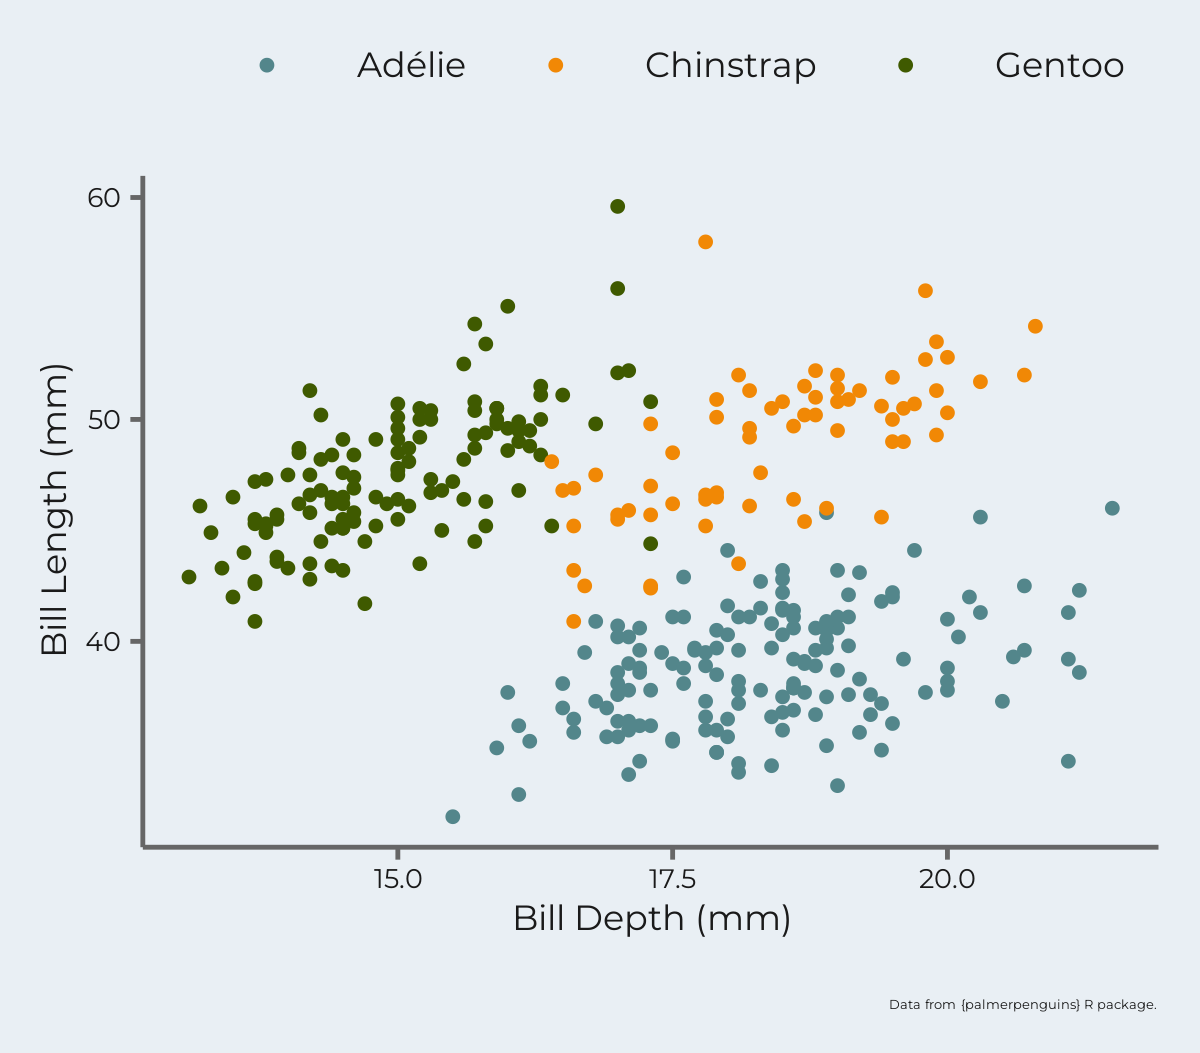
You can add color to a scatter plot to show different groups.
Species is used to make each point a different color, and we can see the pattern of bill depth and length by species.
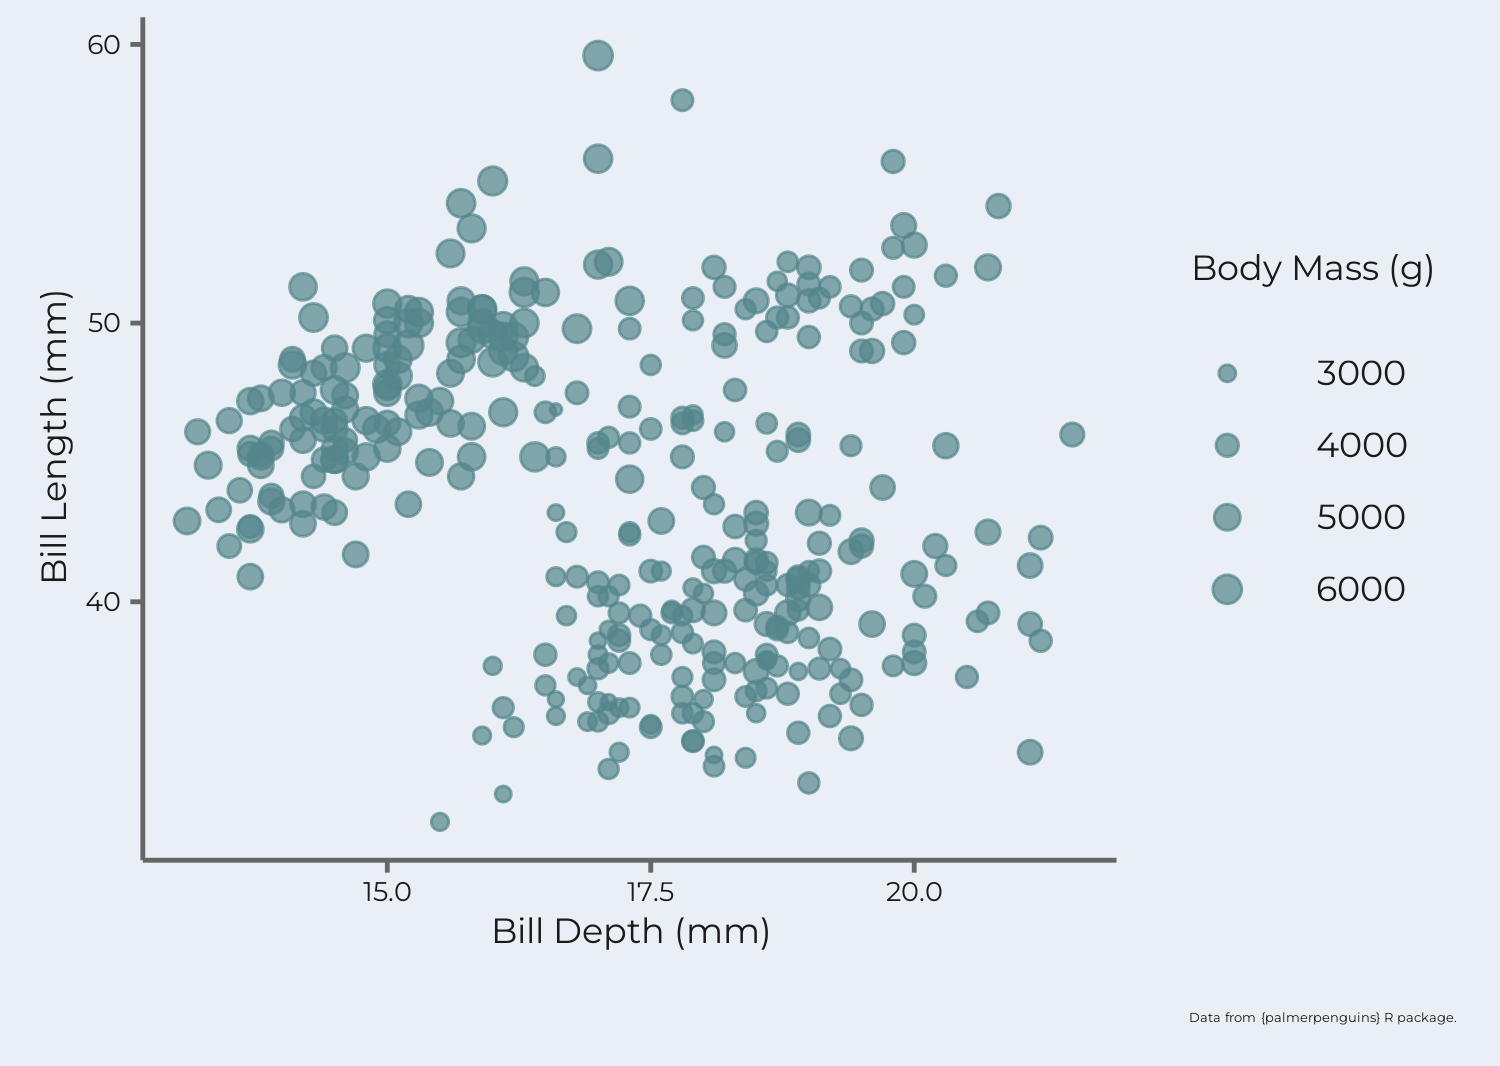
You can also add a third numeric value to a scatter plot by changing the size of the points.
Body mass has been added to see if there is a relationship between bill depth, bill length, and body mass among the penguins.
Scatter plots are very useful for exploring patterns!
Subscribe to our newsletter for more data visualization tips and to be the first to know when our courses are released!
Stay connected with news and updates!
Join our mailing list to receive the latest news and updates from our team.
Don't worry, your information will not be shared.
We hate SPAM. We will never sell your information, for any reason.
