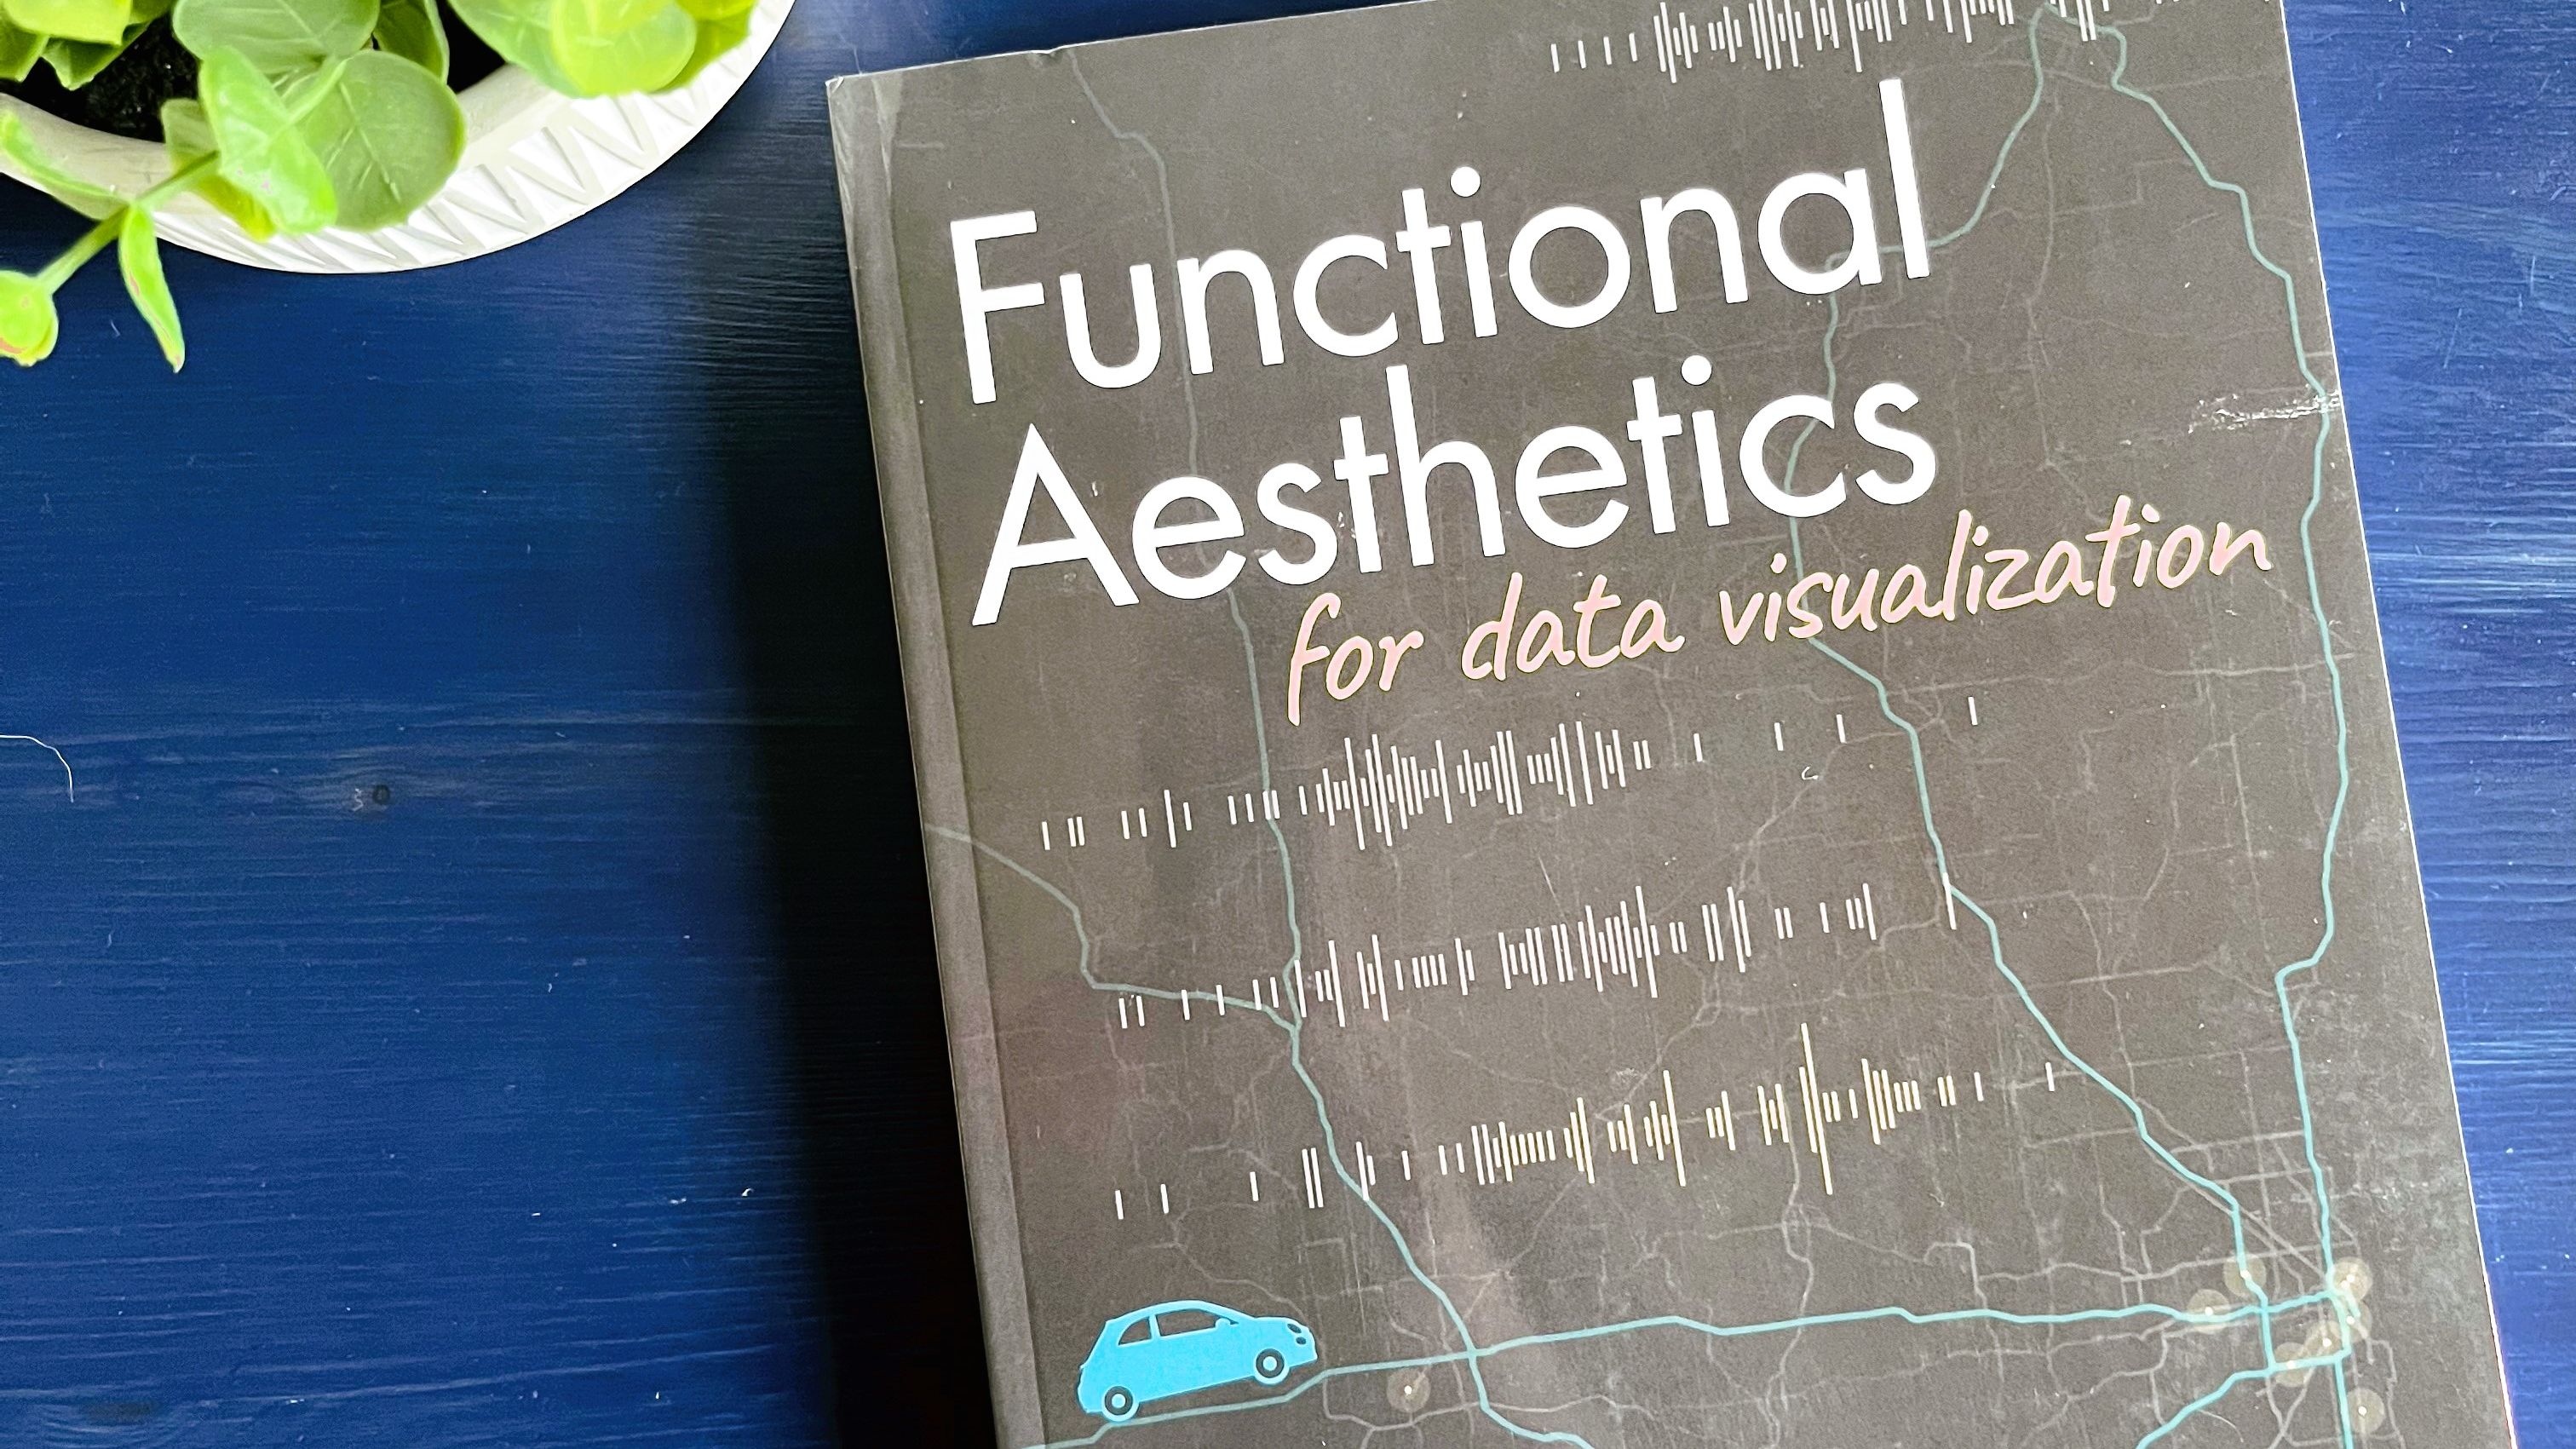
REVIEW: Functional Aesthetics for Data Visualization by Bridget Cogley and Vidya Setlur
Mar 17, 2023
The book Functional Aesthetics for Data Visualization by Bridget Cogley and Vidya Setlur is a dialogue between a researcher (Vidya Setlur) and a practitioner (Bridget Cogley) on design in data visualization. It's not meant to be an introductory book, rather it is a deep exploration of the makeup of visualizations and how we can be more intentional in our chart design.
From the fourth chapter of the book, the authors state that "the process of creating functionally aesthetic visualizations deals specifically with understanding the forms and functions of individual charts and skillfully composing them into an effective representation." The book spends a lot of time examining forms, functions, and structures of data visualization.
I found the first two sections of the book a bit challenging to get into. The authors make several analogies between data visualization and the presentation of food, and some of the food and bento box comparisons didn't really work for me (but perhaps that's because I don't go out to eat very often nor do I eat sushi). I also found the writing a bit challenging to read at times - sometimes it was too academic and other times it felt a little clunky.
However, in the second section, I really enjoyed the comparison between the meaning and ambiguity of words and the meaning and ambiguity of data and how context is involved in the interpretation of both words and data. I love this quote on page 87 of the book: "Charts are a written language for data." I had never thought of charts that way!
The second section also discusses data literacy and orality in comparison to general literacy and language - this part is very interesting although at times it gets very complex. There's a chapter on criticality of processing and understanding data before entering into the practice of visualizing it, which I completely agreed with, and eventually, the book gets into some specific advice for reducing visual clutter and designing dashboards for mobile devices.
I appreciated the authors' take on data visualizations as a conversation with the user and the thoroughness with which they discussed how the aesthetics and design of a visualization impact how the user interacts and understands it. As a former teacher, I also really appreciated the application of scaffolding (supporting the user in their interpretation of the information and graphics).
I really enjoyed the many references and examples in the book to natural language processing of user requests to display certain data, change a visualization, or add annotations. This was a really neat area of research to learn about that I was unfamiliar with before reading this book.
The book ends with two tools - a very detailed checklist and a higher level matrix - to help the reader build better visualizations based on the ideas in the book.
Functional Aesthetics for Data Visualization by Bridget Cogley and Vidya Setlur provides a comprehensive and deep dive into the art of crafting a data viz with the user in mind. I think this quote towards the end of the book captures the complete picture of a visualization that the book dives into: "Visualizations are not mere charts but an ecosystem that encompasses the text, non-chart graphics, and the new ways in which everything is brought together."
If you want to get deep into visualization design and explore the connections between the world outside of data viz and data viz itself, this is a good book for you!
This post contains affiliate links. If you use these links to buy something I may earn a commission. Thank you!
Stay connected with news and updates!
Join our mailing list to receive the latest news and updates from our team.
Don't worry, your information will not be shared.
We hate SPAM. We will never sell your information, for any reason.
